ImpactIQ Industrial Software
ImpactIQ is Motion Controls Robotics’ software for managing large data transfers in manufacturing. It connects to your databases via ODBC, providing a cost-effective solution for tracking and storing vast product data, monitoring system performance, and handling alarms.
ImpactIQ allows manufacturers to use dashboards for management, efficiently store product data, track issues, integrate barcode labeling, and optimize performance monitoring without relying on costly PLC memory. This solution enhances safety, scalability, and data accessibility for large-scale operations.
Integration Options
- Integration of ImpactIQ can be included in your system proposal
- You may be able to add ImpactIQ to your installed robotic system
Bridge the gap between the front office and the plant floor with the ImpactIQ Industrial Software Modules
Click image to read more about the module
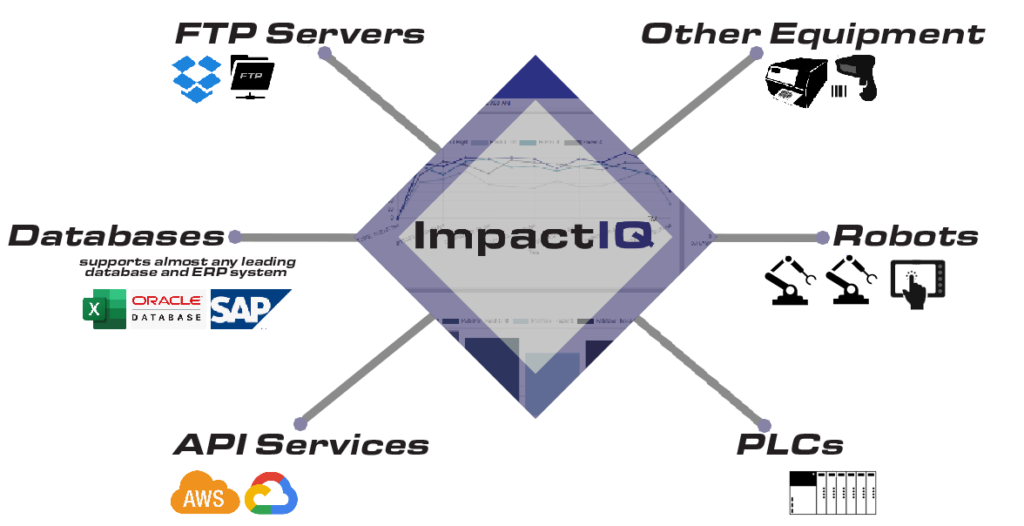
ImpactIQTM Core connects to PLCs, Robots, and industrial devices to act as a gateway for collecting process data and exchanging data between the front office and the production floor.
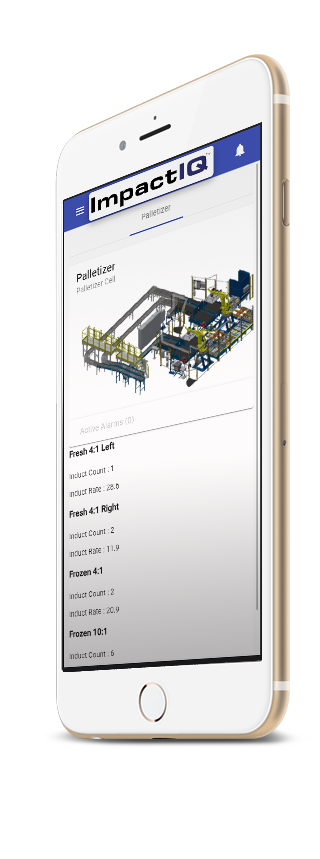
The ImpactIQ Industrial Software Suite consists of six (6) modules. Modules can be purchased ala carte to meet individual project requirements. The ImpactIQ Industrial Software Modules can be viewed on any PC, Tablet, or Mobile phone.
Application & Database Interface Module
Interface with front office ERP/WMS/OMS applications and databases to import and export data such as labels, orders, recipes, and production statistics.
- SQL connector
- Integrate databases with your industrial process.
- Trigger queries at set intervals or trigger with automation devices connected to ImpactIQ
- Example applications:
- Send label data to the labeling module directly from a SQL database
- Update order completion status in a database
- FTP Connector
- Exchange and parse CSV/delimited files
- Import SKUS/Orders from a CSV file on a remote file server
- Export a list of events from the alarm & event logging module to a spreadsheet or CSV file and upload automatically to a remote server
- Exchange and parse CSV/delimited files
- API Connector
- Exchange data between ImpactIQ modules and online applications such as e-commerce platforms or online ERP systems
- Support for custom API endpoints
- Trigger API calls from events that occur within ImpactIQ modules
- Examples:
- Call an API to retrieve and print a label after being weighed and tracked on a conveying line
- Examples:
ImpactIQ Module Usage Examples:
Alarms & Event Logging
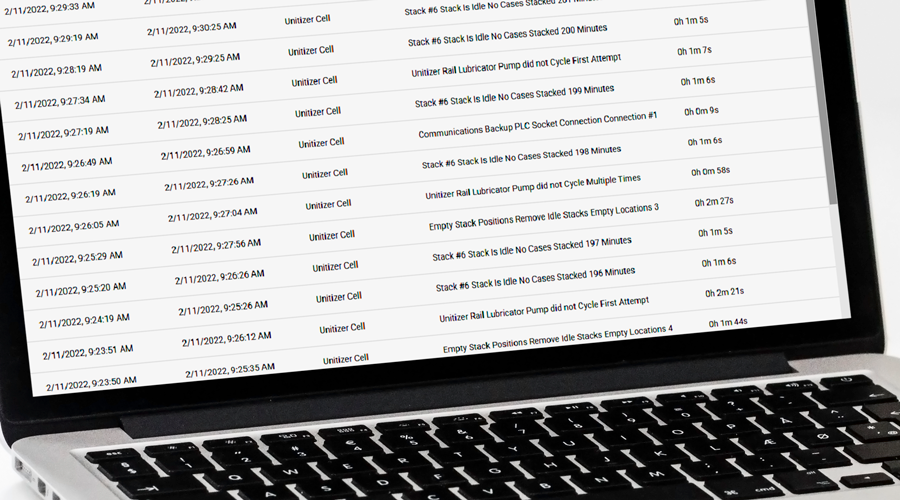
Record faults and event history for every device connected to ImpactIQ – Keep a record of every fault and event that occurs. Easily discover recurring events and alarms by generating reports and viewing trend data through the ImpactIQTM user interface.
- Record timestamped events that occur in the system over time
- View alarm and event history through the ImpactIQ web-based interface
- Create custom alarms based on tag values in the PLC or register values in a robot
- Trigger custom alarms based on low or high setpoints
- View an overview of all alarms for every area
- Useful for large systems
Recipe & Order Management
Store and edit thousands or recipes and orders, and schedule runs using the web-based user interface and eliminate the need to enter information from the production floor HMI.
- Item #
- Description
- Size
- Weight
- Color
- Other Data
- Pick Position
- Line Number
- Items/Layer
- Other Directions
- Schedule Start/End Times
- Required Quantities
- SKUs to run directly from the ImpactIQ order management screen
- Import new recipes directly from ERP/WMS/OMS applications or databases using the interface module
- Edit SKU & Recipe data from the ImpactIQ web-based user interface.
- Import/Export Recipes & Orders
- Import your data from spreadsheets or flat files through the ImpactIQ Recipe/Order management web-based user interface.
- Import existing order data directly from ERP/WMS/OMS applications or databases using the interface module.
- Buffer Orders using ImpactIQ as an intermediate database
- Import orders for a shift, day, or week, etc. into ImpactIQ to be recalled later.
Tracking & Traceability
Track where a product is through its entirety in the automation system.
- Store and review timestamped events for a product lifecycle through an automation system.
- Track Uniquely Identified items with existing label or product barcodes.
- Add tracking to almost any system by utilizing barcode scanners connected directly to ImpactIQ
- Attach tracking items to specific lot & order numbers
- Export tracking information to spreadsheets or CSV files
- Exchange tracking information with databases or applications using the application interface module
Track data points such as:
- Weight
- Dimensions
- Current location in the system
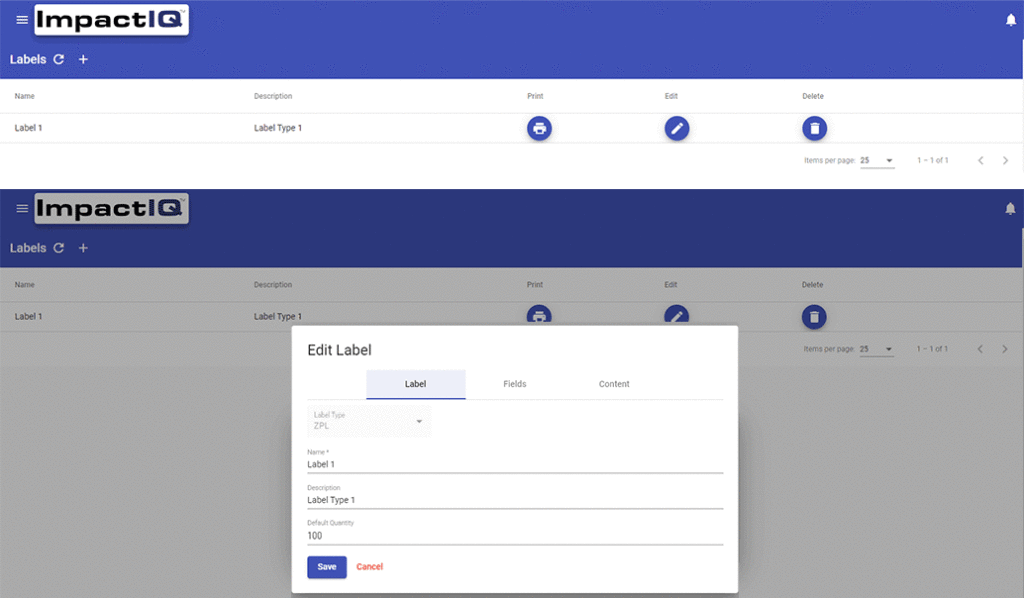
The Labeling Module can be used to print and apply tracking (License Plate) labels to items or cartons.
Labeling
Print labels of any size and any format to almost any printer including Zebra, Sato, and Datamax – Write data from any data source to RFID tags.
Print the same label every time or print labels with dynamic fields such as:
- License plate numbers
- Timestamps
- Batch/Lot Numbers
- SKUs
- Automatically serialize fields on labels or RFID tags
Works with third party or existing equipment
Trigger prints with a plc, robot, socket message, or hardwired trigger from sensors or pushbuttons
Utilize the application Interface module to:
- Insert data from Excel, Microsoft Access, or flat file to automatically fill label fields
- Import dynamic label data from any database, ERP/OMS/WMS application, or customer file server.
