MCRI ImpactIQ Dashboarding
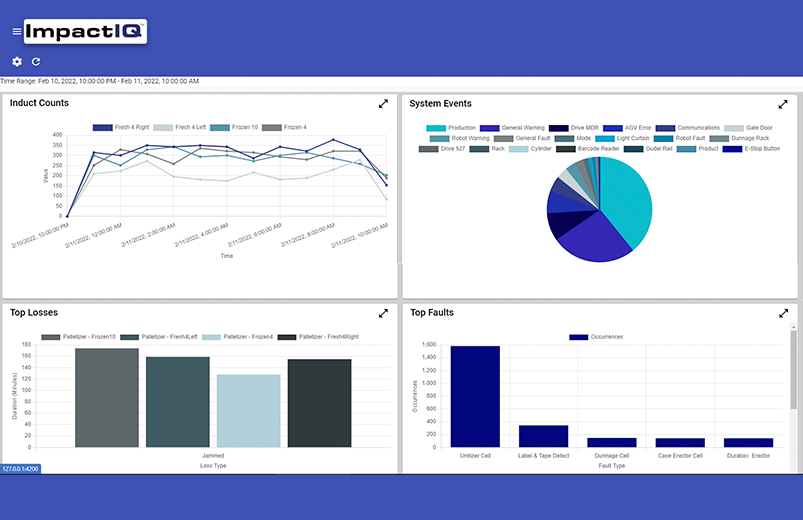
Put Your Data to Work
Dashboarding and Production Data Visualization Suite
Your machines are producing a lot of valuable data, but are you capturing and taking advantage of it?
- How many rejects did we have today?
- What was our efficiency today?
- What was our uptime percentage?
- What were our top losses?
These are all common questions you may have when tracking the productivity and efficiency of your system.
ImpactIQTM Dashboarding gives you valuable insights on how your systems are performing by providing powerful metrics to help keep your plant productive.
What is MCRI ImpactIQ Dashboarding?
Live, Up-to-Date Snapshot of Production
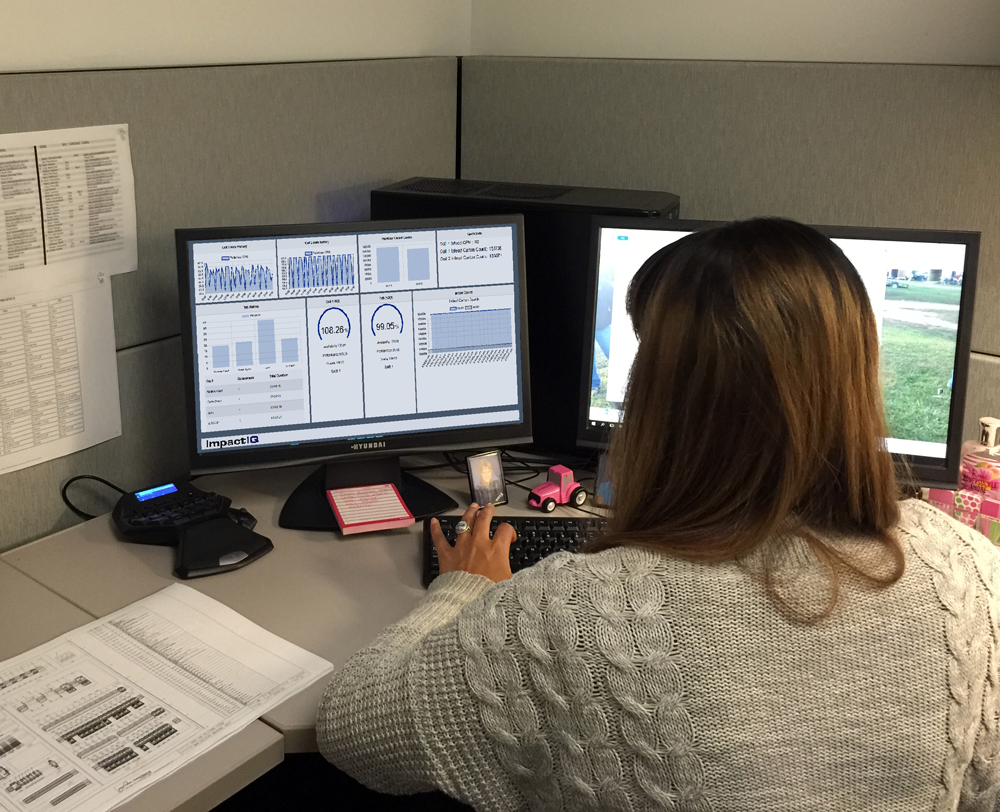
ImpactIQTM Dashboarding is a data visualization tool that provides a live snapshot of your system from anywhere. ImpactIQTM Dashboards are accessed through any device such as a PC, tablet, or smart phone.
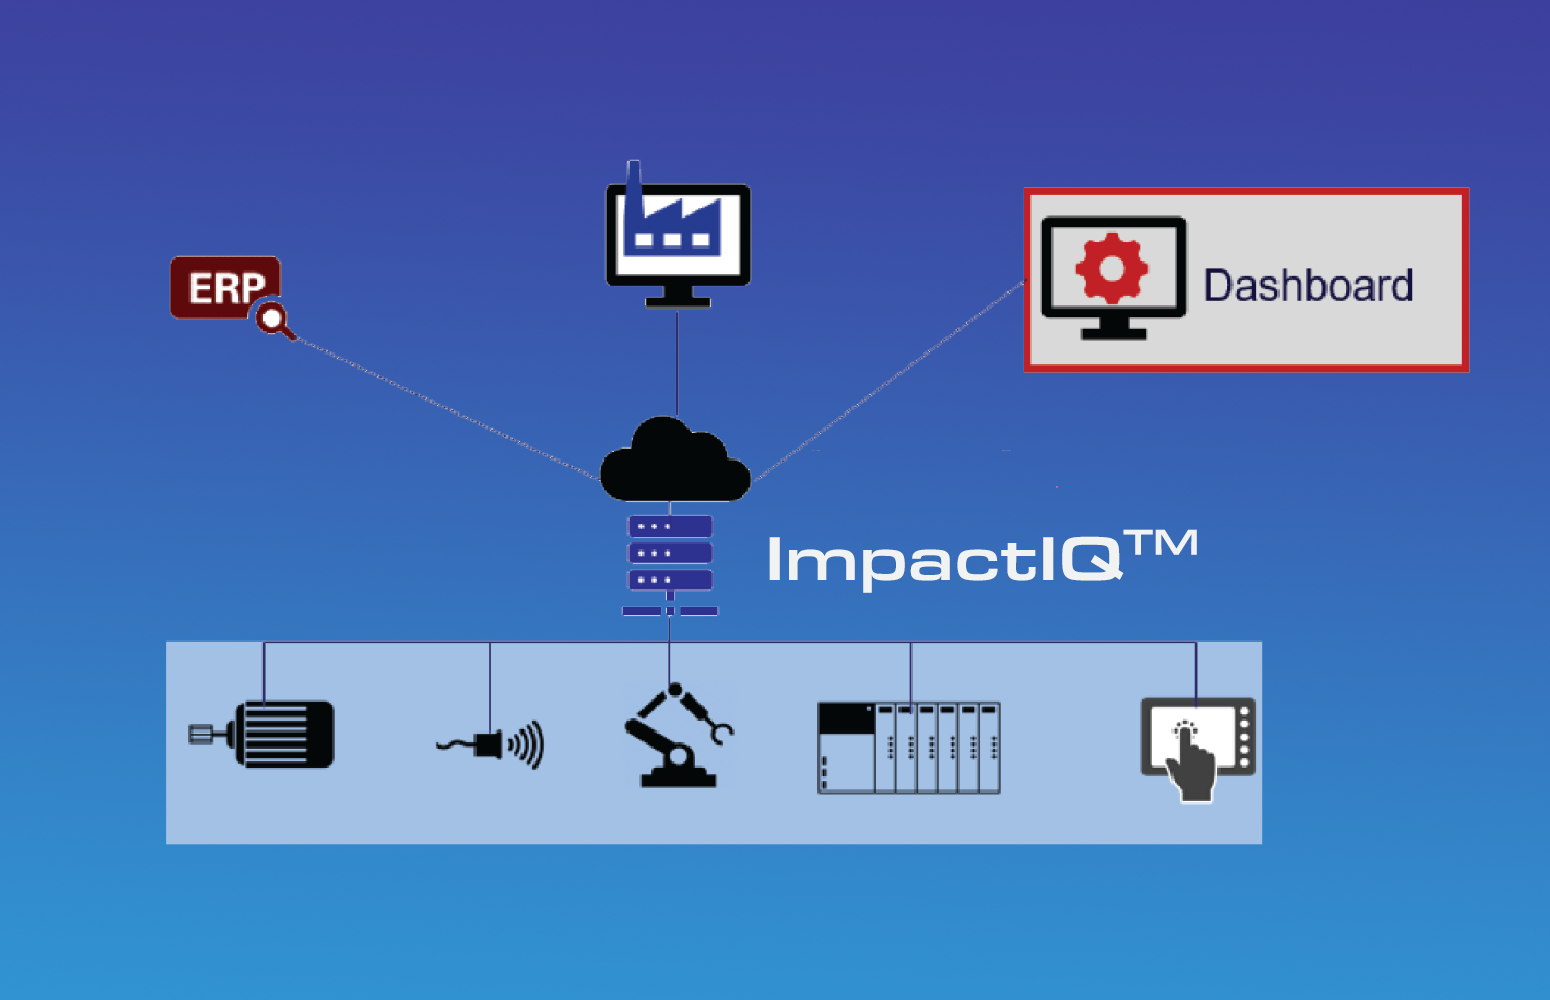
ImpactIQTM Dashboarding will gather production and health data from PLCs, Robots, Drives, Sensors, etc. and display this data through a web-based user interface.
ImpactIQTM Dashboarding provides seamless integration to the most popular ERP systems to easily display target rates and metrics for shift goals.
Benefits of ImpactIQ Dashboarding
Instant OEE Calculation
ImpactIQTM Dashboaridng will automatically calculate OEE allowing for real time adjustments and responses to your production process.
Eliminate Manual Data Collection
Production metrics such as counts, times, events, and alarms are recorded at automatic intervals. This data is then aggregated to provide powerful visual KPIs.
Powerful KPI Visualization for Production Metrics
Display critical KPIs for each line or the entire system in an easy-to-read graphical dashboard.
Easily Identify Top Losses
ImpactIQTM Dashboaridng easily identifies your top production time losses with an easy-to-read graphical representation.
Monitor and Track Downtime Events
ImpactIQTM Dashboaridng automatically identifies, detect, trend, and alert reoccurring alarms and events.
Advanced Reporting
ImpactIQTM Dashboarding will generate end of shift production summary reports with the click of a button. Customize these reports to include a variety of metrics.
Log Events and Alarms for Troubleshooting
Filter alarms based on status, time, event, and duration. Alarm logging allows you to keep an eye on recurring faults to help identify problems before downtime occurs from broken or worn devices.
Track Downtime Events
Minimize Downtime Events & Top Losses
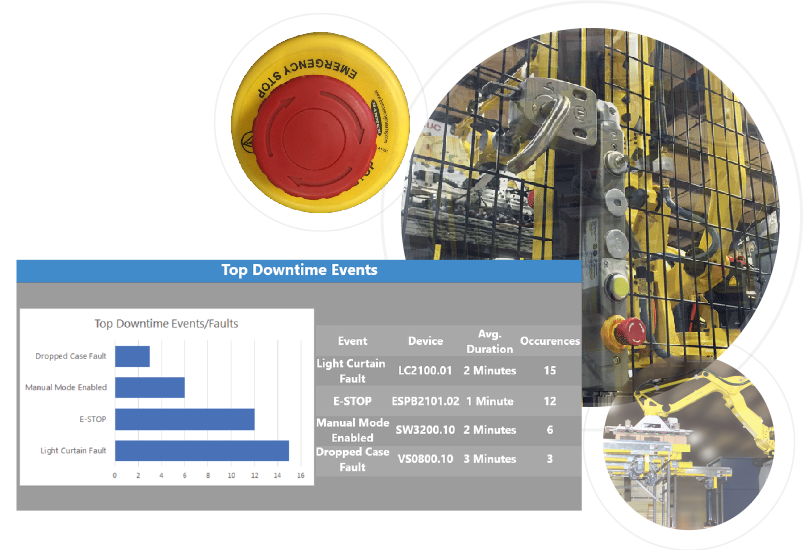
See every second of downtime through easy-to-read charts and tables. See the top downtime events ordered by total downtime or number of occurrences.
ImpactIQTM Dashboarding will group the top occurring downtime events by device and display the average duration.
ImpactIQTM Dashboarding allows you to visualize how much time is being lost from downtime events. Whether your loss is a small stop, slow cycle, or reject, ImpactIQTM Dashboarding tracks it all down to the second.
ImpactIQTM Dashboarding will identify the following loss types and rank them by the largest impact.
- OEE Lost Time
- Availability Lost Time
- Performance Lost Time
- Quality Lost Time
Use these metrics to identify process and training problems and set goals to improve these metrics for the next shift. In addition, these metrics can help operators and shift supervisors detect mechanical issues causing production losses
Dashboarding Demo Video
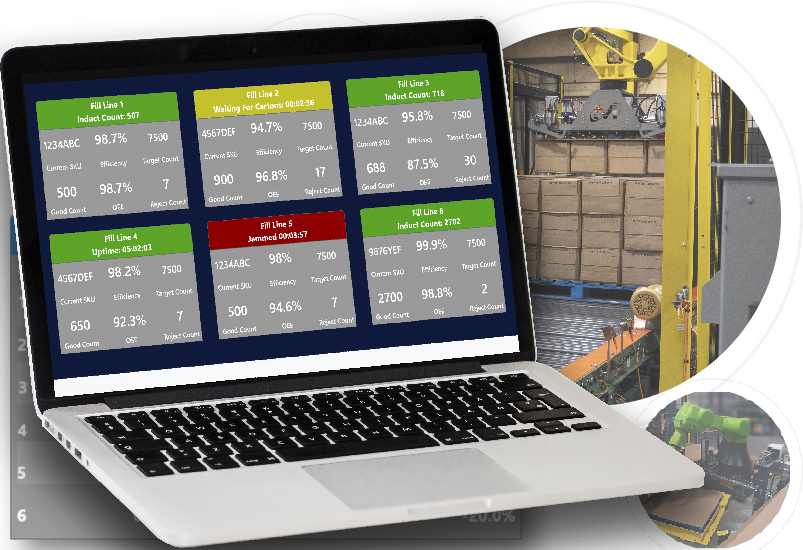
Instant OEE and Powerful KPIs
Easily Identify & Compare the Data You Need
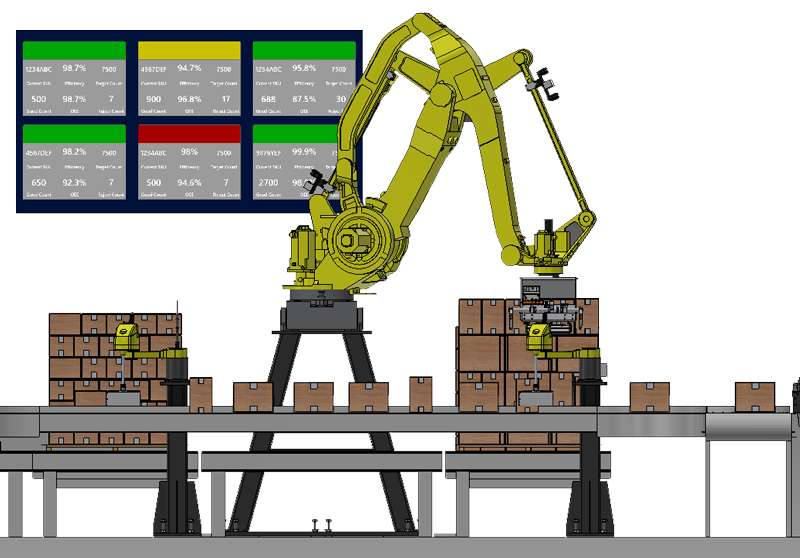
ImpactIQTM Dashboarding allows you to see the efficiency for each production line and OEE (Overall equipment effectiveness) for the entire system.
Easily compare inducted vs reject vs total counts to calculate production line efficiency.
Easily identify production rate issues by setting color coded alerts when a metric falls below a setpoint.
- Green: Running/Normal Operation
- Yellow: Warning
- Red: Not Running/Alarm
Colors and alert setpoints can be customized to meet specific requirements.
Data Security & Scalability
One-Way Data Flow = Safe Connectivity
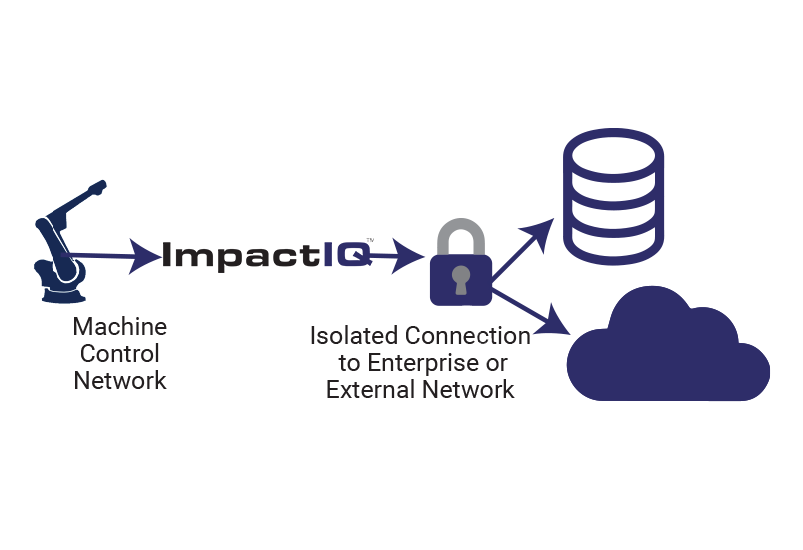
The ImpactIQTM Dashboarding architecture ensures one-way data flow from the machine control network to external services and databases outside of the ImpactIQTM Dashboarding server. This ensures safe connections to the cloud for remote data processing or storage.
While ImpactIQTM Dashboarding is designed to work seamlessly with all MCRI systems, ImpactIQTM Dashboarding can easily integrate with 3rd party equipment. This allows for production data from multiple pieces of machinery to be aggregated at a single point.
ImpactIQTM Dashboarding’s web-based architecture allows for instant scalability both within your local production environment or across the globe. Implement one dashboard display to start and add more.
ImpactIQTM Dashboarding is built with flexible hosting applications. Typical Installations are hosted on an industrial grade PC mounted inside the main system cabinet.
ImpactIQTM Dashboarding can also be hosted on popular cloud architecture services such as Amazon Web Services, Microsoft Azure, and Google Cloud Services. This allows for multi-site data collection and one login endpoint for all your dashboards.
Automatic Business Intelligence Data Collector
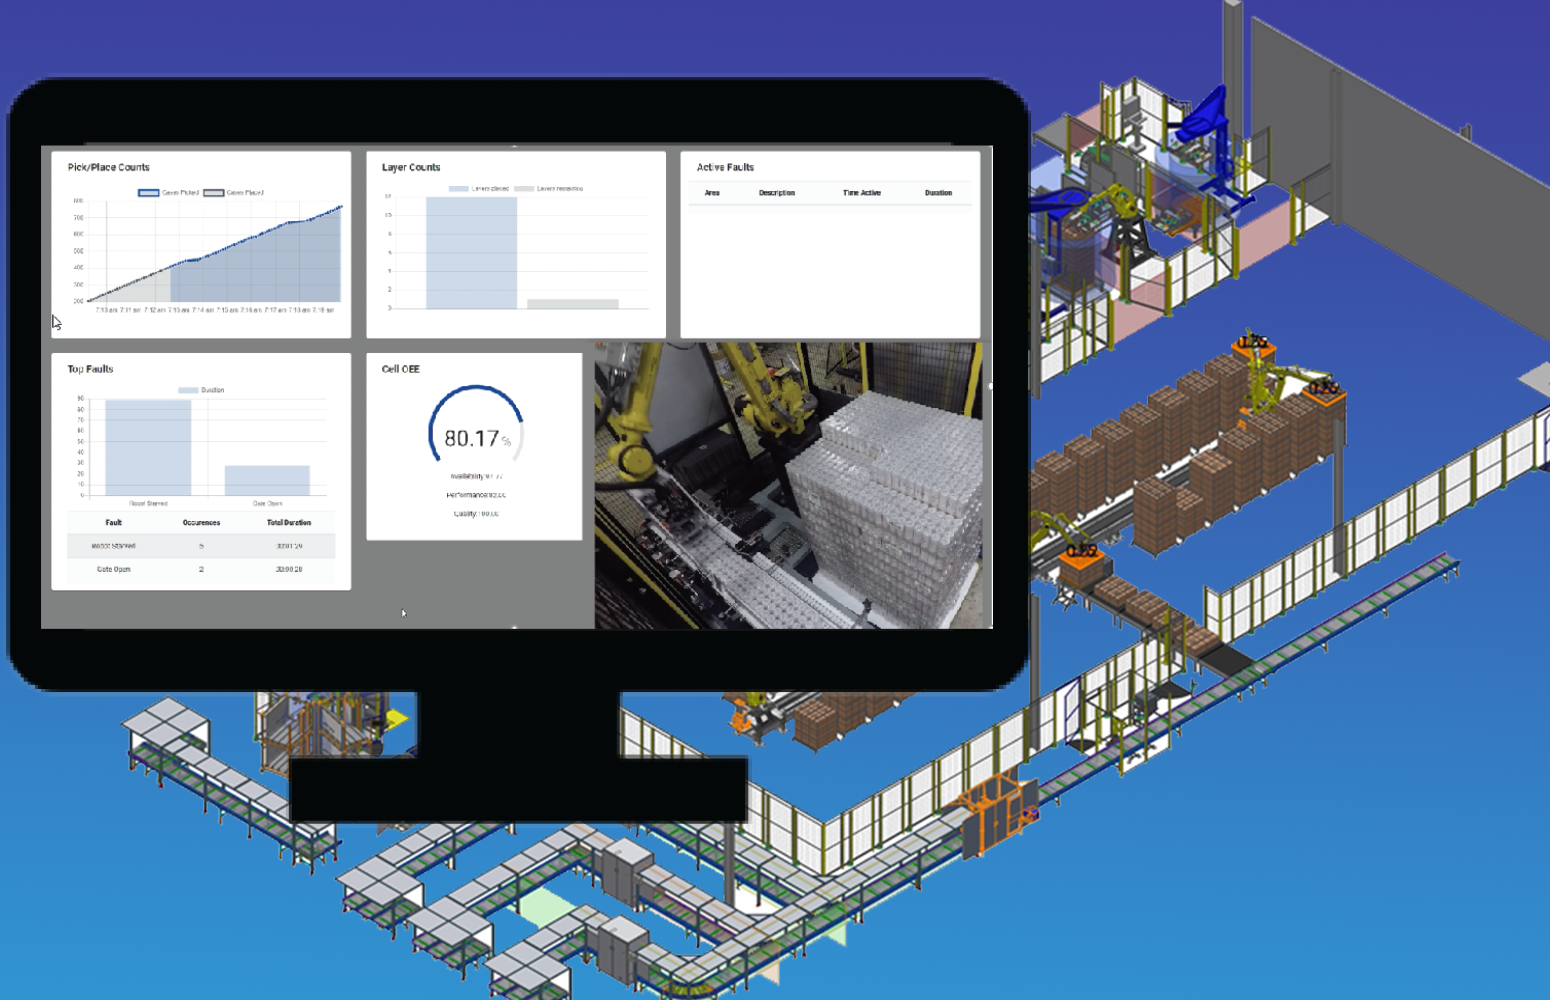
ImpactIQTM Dashboarding’s data collection engine can display:
- A live stream of your system
- Counts
- Induction Counts
- Reject Counts
- Count Variance
- Times
- Equipment Uptime/Availability
- Run Times
- Down Times
- Planned Stop Times
- Unplanned Stop Times
- Slow Cycle Times
- Mean Time to Failure (MTTF)
- Mean Time Between Failures (MTBF)
- Mean Time to Recover
- Mean Time to Response
- Events
- Tool Changeover Events
- Robot Cell Entry Events
- Automatic/Manual Mode Changeover
- Shift Start and End Events
- Custom Events to meet specific project requirements.
- Alarms
- Active and Past Faults
- E-STOPs
- Device Faults such as motor overloads, drive faults, robot faults, etc.
And Much More!
