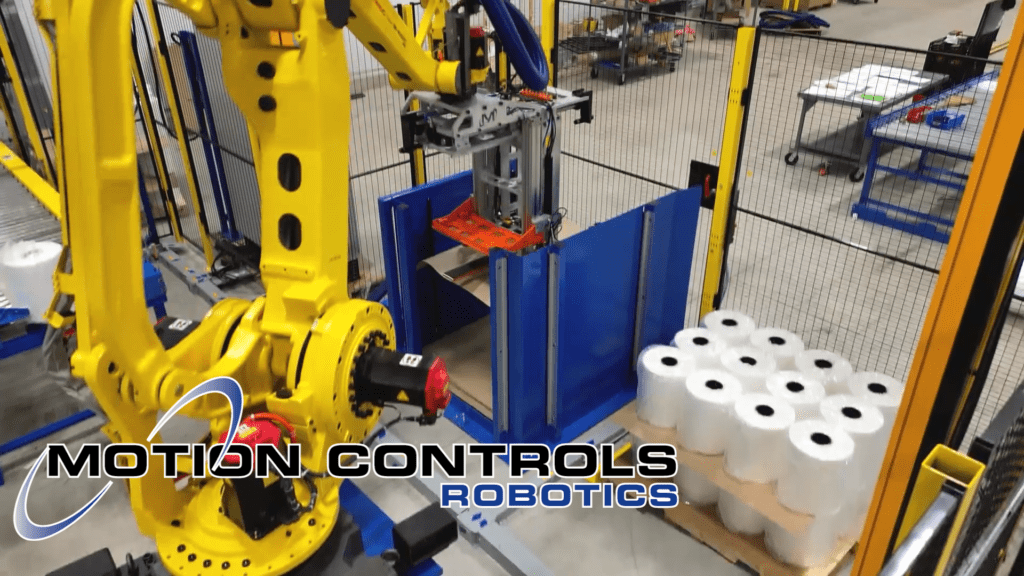
A Palletizing Machine-Dual M-Stack
As an advanced industrial automation palletizer, the Dual M-Stack delivers reliable, high-speed palletizing across two product lines. This system is…
Read Article
Dashboarding takes the information collected from your system and puts the data to work for you. The information gathered includes production and health data from:
As a result, this massive amount of information is quickly and easily viewed through simple to read charts on any device such as a PC, tablet, or smart phone.
While viewing this data in real time is extremely useful for optimal performance, you are also able to collect and collate historical data to discover trends. These types of historical reports bring to light issues that may have gone unnoticed for months or years before you had dashboarding availability.
Generate daily or historical (various time ranges) reports on demand from data gathered about production. Build automated reports that can be emailed directly to maintenance or managers to keep them updated on relevant information.
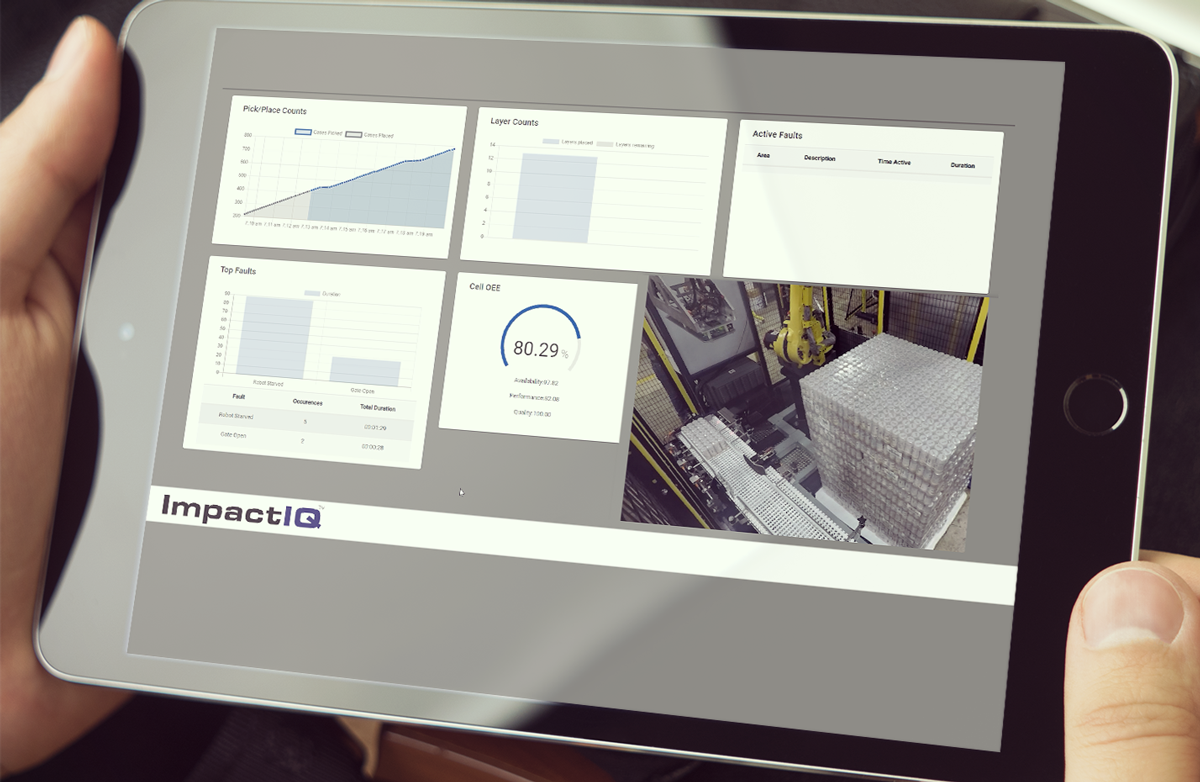
A dashboard is a live or historical view of selected production statistics. The main screen shows only the information that is most relevant to your system. Basically, the library of widgets that can be displayed are endless, because they are completely customizable to display exactly what you want to learn about your system.
Here are some examples of charts available through a dashboard:
Keeping a full set of analytics on your automated systems, allows you to keep all the data you need right at your fingertips. It allows you to answer the question of overall equipment effectiveness (OEE) with a glance at your system’s dashboard. This part alone gives time back to the process engineer to solve issues instead of finding issues.
You watched in the video above the full dashboard demo and saw how the OEE changed with different events, so now we will take a closer look at OEE.
Availability: This is the percentage of time that the system was running (not stopped for alarms like gate open for 28 seconds) and should have been able to run product. 
Actual Run Time
Planned Production Time
Performance: This number is based on the goal of production in relation to the amount of product that ran through the system. In this instance the number of cases palletized (in the demo you will see starvation occurred for a total of 1:29 minutes). This is calculated using:
 Ideal Cycle Time × Total Pieces Ran
Operating Time
Quality: This aspect looks at how many products were rejected during the run (the example in the demo had no quality issues). Quality is calculated as
 Good Parts
Total Parts
For the final OEE number multiple the three totals.
You can develop this type of chart to track improvement and watch those green lines get longer by using dashboarding and reporting to gather and chart data.
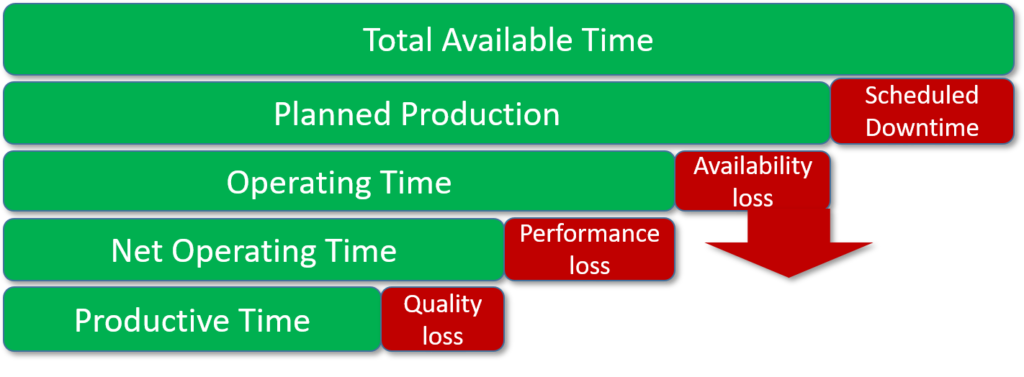
The chart above, developed by FANUC, is a great way to show improvements you are seeing in your system because of dashboarding and reporting. Develop your starting chart and then after you have used data provided to solve issues, look at the improvements.
The top line is how many production hours you have scheduled to finish a product order. Most schedulers use past data to account for downtime averages. In the past, other issues with the system are impossible to predict, but with dashboarding, you can pull up the data on previous runs and see what issues occurred and either account for that timing or remove those issues.
Dashboarding spells all this information out, for not only today’s run but any multiple amounts of runs you want to look back to analyze.